Hi there! We are 1ESO students of high school Sunsi
Mora in Canet de Mar. Here is our survey of fish captures of Arenys harbor. Graphic Arenys captures
The most fished
The Sardinian or sardine (Sardina pilchardus) is a fish of
around Clupeiformes, the family of clupeidae, bluish, the flanks and belly
silvery color bright, inhabiting coastal areas that captures and consumes in
large quantities because of its high nutritional value.
The anchovy or anchovy (Engraulis encrasicolus) is a family
of fish clupeidae, often consumed preserved in water and salt, taking the name
anchovy. By extension, the anchovy is the common name given to the anchovies in
many parts of Valencia and southern Catalonia.
On behalf of the S'Agulla Team and myself, I would like to congratulate you for all the hard work. WELL DONE!!!
You have done lovely presentations to introduce yourselves and showed us a little about the bit of ocean that you enjoy!
Now we know that the Sea Surface Temperature (SST) is not even. Compared to last January-February, average SST it is similar. However the years with largest and smallest SST oscillations are quite different!
Taking the measure of the Secchi depth was not possible for none of you. In any case, remember that plankton is the base of the marine food chain!
You have all surveyed beaches of similar granulometry, so you didn't find any differences in the beach profiles; but, I can tell you that with thicker sand, the slope of the beach front is steeper!
It has been fantastic to know your ‘marine menu’. All these marine species are very tasty to me! Pitty that at the end most of you didn't manage to keep to deadlines. Nevertheless, don't miss the opportunity to compare your results with the rest of participating schools. There's a fantastic variety of fish that we can eat!
I've also had a lot of fun discovering what the inland looks like through your audioguides. Those who haven't finished yet you can still post them within this month!
Thank you for all your collaboration and CONGRATULATIONS!!!!
You can see what we have discovered in our visit to the auction market in the harbour of Barcelone.
Last week it has been an accident in the port and some fishermen have died. We are so sorry for them.
We have made a survey at the fishermen's pier and we have discovered many things. You can see our presentation. We are sorry, Picktochart didn't worked.
I'm very impressed by all the good work you are doing! While you are finishing off the infographic of the marine species we are moving on to the last activity of the Oceans project: the audioguide!
Activity nº 5: Audioguide Objective: create an itinerary of the 'Fish Route', specifying the location of the fishing grounds, port, fish market and other information of your interest!
ICT suggested:Eduloc >> or Genially >>(although Genially is not exaclty an audioguide programme you can create an interactive map with it too!)
Source of data:
Survey you have already done
Internet
(Teachers will supply you with the tutorial of Eduloc for Oceans)
Label of the post:audioguide
Deadline to complete the form:27th March Suggestion: We recommend working in teams, where every group is in charge to look up different kinds of information or different locations in your route.
So you have already gathered and analysed the data referring to the sand!
Let's have a look... (Last update 27/03/2017)
Happy to see that all your coordinates are so accurate!
Let's have a look at your data. This is very interesting, you have very colourful beaches!
I have a question for the Col·legi Cardenal Vidal i Barraquer and for the Fenerbahçe College: is the sand made of the same minerals as the surrounding area, or does it come from up the coast?
And what a coincidence, all of you have very small granulometry, so you are getting similar results. By the way, Fenerbahçe College, are you sure you got the size of the heap of sand right when you did the experiment?
Well, I'm afraid that we'll have to wait and see the results of the other participating schools. Hopefully someone will have thicker grain and we'll be able to see the difference it makes!
So please, those that haven't done it yet, send your data! The Sand >>
You are all doing a great job!!!!!
Sharky
PS - update 27/03/2017 Thank you South East High School for your data! I'm afraid that one of the objectives of this section is to let you see the effect of different granulometry on the shape of the beaches, but all of you have the same type of sand! Basically the thicker the sand, the steeper the beach front is. Also nourished beaches act as if they were of thicker sand because there's a mixture of all kinds of sizes of grain due to the human action. So these beaches are also steeper than a natural beach of the same granulometry. WELL DONE!
Friday, 24 February 2017
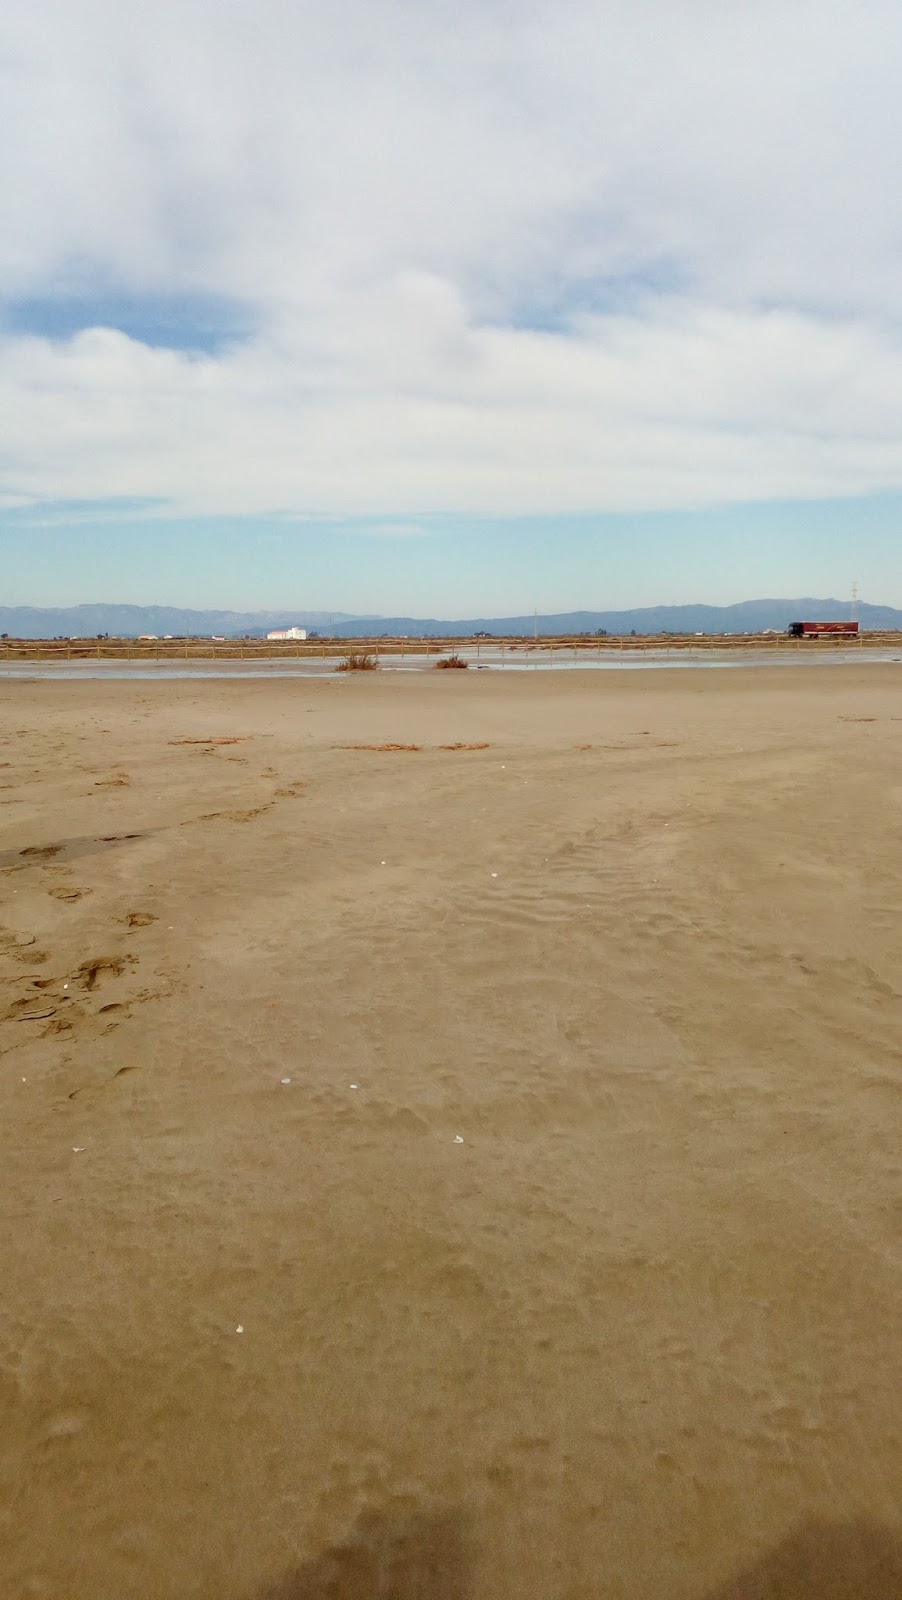
This is Prat d'en Forès beach in Cambrils. Spain.
Horitzon view
Left view
Back view
Right view
Thursday, 23 February 2017
Hi there! We are the students from Canet de Mar and we are back! We already done the sampling on the beach, completed the worksheet and here are our pictures, I hope you like it!
While you are finishing off activity nº3 the Sand, we are moving on to the next activity.
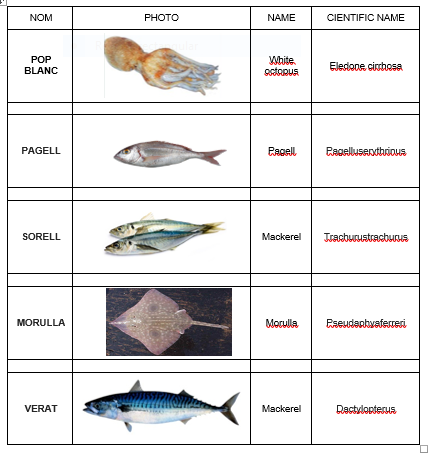
Activity nº 4: Marine species Objective: create an infographic of the 10 most important species caught by the fishermen of your closest port using the ICT Piktochart >>
You will have to create an account, sign in, choose the option infographic, scroll down, choose the first template (Create your own infographic)and start editing.
Information included in the infographic:
An infographic is made by blocks, in the first block put the Title and Authors.
In the following blocks you will describe the marine species with the following information:
-Photo or some kind of illustration that allows its identification -Common name in the local language -Common name in English (only if local language is not English) -Scientific name In the last block put two graphs: -Percentage that each species represents of the annual turn over -Percentage that each species represents of tonnes captured annually You can add any other information of YOUR INTEREST!
Once you have finished you can publish it and post the link provided by Piktochart on this blog to share it! Source of data:
Survey at the port
Internet
(Teachers will supply you with the information about the survey, webpages and tutorial of Piktochart) Label of the post:species
Deadline to complete the form:13th March Suggestion: We recommend working in teams, where every group is in charge to look up different kinds of information.
Please remember only one infographic per class!
Looking forward to know the food I can have in your area, yummy!
All the best!
I'm happy to see so much progress! And thank you so much for your photos!!!! Now I understand why by Santa Monica beach (USA) I see strange coloured lights, there's a funfair!
So let's see what your sea looks like...(last update 27th February)
Ups! I'm afraid that some of the coordinates are not quite clear. Ins Priorat 1ºB, Col·legi Cardenal Vidal i Barraquer and Private Fenerbahçe College need to add more decimals to their coordinates. If you check on Google Earth you'll see that some of you are a bit inland and others in the middle of the sea. The Earth is a rather big planet and decimals are important!
I see that the Sea Surface Temperature (SST) you have measured is quite similar to the average of the last 14 years, except for Barcelona. It looks like you are having a mild winter there!
And yes, there's really only one ocean interconnected. You can check it out yourself on this video!
About the currents those of the western Mediterranean have got it right, the Liguro-Provençal current passes by you doorstep. However in the case of Istanbul you are a bit far away from the Gulf Current. But you are right about the Bosphorus strait it connects the Black and Marmara seas. The Black sea receives more freshwater from rain and rivers that what it loses from evaporation, making its sea level higher than the Marmara's. The surplus of water therefore flows through the Bosphorus into the Marmara Sea. Thus two flows through the straits are formed. The upper flow leaves the Black Sea and carries surface water out of it. Meanwhile a bottom flow carries salt water, from the Mediterranean to the Black Sea. (More information here >>)
QUESTION:
If you look at the average SST data of the last 14 years, in Turkey the values are persistently lower than in the wester Mediterranean. Considering that you are all at roughly the same latitude, how is it possible? Do you think the currents at the Bosphorus strait have something to do with it?
Looking forward to your comments!
(Just press on the ‘Comment’ option at the end of this post and leave
your message)
And for those that haven't sent their data, send it as soon as possible and I'll update this post!
Cheers!
Sharky
Update 27th February: Hello South East High School and Ins Sunsi Mora. Thank you for your data! Looking over the SST, Ins Sunsi Mora have a bit of unusual data, are you sure that your monthly average is 27ºC?
So South East High School, thanks to the California Current have similar SST than in the Mediterranean side of Spain although you are closer to the Equator. This is very interesting!
Now we're curious about the results of SST at both ends of the Mediterranean. Fenerbahçe College has made a suggestion. Do you agree with them?
(Just press on "comments" below and leave you message!)
Best wishes! Sharky
Hello from Istanbul, Location of the water temperature taken is Kartal, from the rocks on the sea side, Coordinate where the water temperature was measured: 40.8852629, 29.1031036
Hello from Falset,
We are the 1st ESO B class of Ins Priorat
Our beach is Platja de l'Aluet from Amposta
GPS coordenates: 40º 38' 06'' N 00º 44' 59'' E
Hello! We are 1st ESO A from INS Priorat in Falset.
These photos are taken from the Aluet Beach, in Amposta.
Coordenates GPS 40º 38' 12'' N 0ª 45' 5'' E
1. Horizon sight
2. Left sight
3. Right sight
4. Back sight
This is our graphic:
Thursday, 9 February 2017
Activity 1
GPS Coordinates of the Santa Monica Beach Latitude: 34.008313 Longitude: -118.496153
Temperature of water: 15 degrees Celsius
Coordinates of where the water was found Latitude: 34.008336 Longitude: -118.496556